Mr. Hovnanian and others with voting power over the shares held by the Estate of Kevork S. Hovnanian, the Limited Partnership, the 2012 LLC and certain family trusts have informed the Company that they intend to vote in favor of the nominees named in this proposal. Because of their collective voting power, this proposal is assured passage.
Our Board of Directors recommends that shareholders vote FOR the election of the nominees named in this proposal to the Company’s Board of Directors.
(2)PROPOSAL 2 — RATIFICATION OF THE SELECTION OF AN INDEPENDENT
REGISTERED PUBLIC ACCOUNTING FIRM
The selection of an independent registered public accounting firm to examine financial statements of the Company to be made available or transmitted to shareholders and to be filed with the SEC for the fiscal year ending October 31, 20132015 is submitted to this Annual Meeting of Shareholders for ratification. Deloitte & Touche LLP has been selected by the Audit Committee of the Company to examine such financial statements. In the event that the shareholders fail to ratify the appointment, the Audit Committee will consider the view of the shareholders in determining its selection of the Company’s independent registered public accounting firm for the subsequent fiscal year. Even if the selection is ratified, the Audit Committee may, in its discretion, direct the appointment of a new independent registered public accounting firm at any time if the Audit Committee determines that such a change would be in the best interests of the Company and its shareholders.
The Company has been advised that representatives of Deloitte & Touche LLP will attend the Annual Meeting of Shareholders to respond to appropriate questions and will be afforded the opportunity to make a statement if the representatives so desire.
Ratification of the selection of Deloitte & Touche LLP as the Company’s independent registered public accounting firm to examine financial statements of the Company for the year ending October 31, 20132015 requires the affirmative vote of a majority of the votes cast by the shareholders of Class A Common Stock and Class B Common Stock, voting together, presentrepresented in person or by proxy at the 20132015 Annual Meeting. In determining whether the proposal has received the requisite number of affirmative votes, abstentions will have no impact on such matter because such shares are not considered votes cast.
Mr. Hovnanian and others with voting power over the shares held by the Estate of Kevork S. Hovnanian, the Limited Partnership, the 2012 LLC and certain family trusts have informed the Company that they intend to vote in favor of this proposal. Because of their collective voting power, this proposal is assured passage.
Our Board of Directors recommends that shareholders vote FOR ratification of the selection of Deloitte & Touche LLP as the Company’s independent registered public accounting firm.
(3) APPROVAL OF AN AMENDMENT TO THE COMPANY’S CERTIFICATE OF INCORPORATION TO INCREASE THE NUMBER OF AUTHORIZED SHARES OF CLASS A COMMON STOCK
On December 14, 2012, subject to shareholder approval, the Board authorized an amendment to our Certificate of Incorporation to increase the number of authorized shares of Class A Common Stock (the “Class A Common Stock”) from 200,000,000 shares to 400,000,000 shares (the “Class A Amendment”). Pursuant to Proposal 4, we are separately proposing an increase to our authorized Class B Common Stock, but we are not proposing an increase to the number of authorized shares of Preferred Stock.
If approved by shareholders, the Class A Amendment would be reflected in an Amended and Restated Certificate of Incorporation of Hovnanian Enterprises, Inc., and the first paragraph of paragraph Fourth of our Certificate of Incorporation would be amended to provide as follows:
“FOURTH: The total number of shares of all classes of stock which the Corporation shall have the authority to issue is 430,100,0001 shares, of which 400,000,000 shares shall be Class A Common Stock having a par value of one cent ($0.01) per share, 30,000,0002 shares shall be Class B Common Stock having a par value of one cent ($0.01) per share and 100,000 shares shall be Preferred Stock having a par value of one cent ($0.01) per share.”If the shareholders approve the proposed amendment, it will become effective upon filing of an Amended and Restated Certificate of Incorporation with the Delaware Secretary of State, which the Company anticipates doing as soon as practicable following shareholder approval.
The newly authorized shares of Class A Common Stock will have all the rights and privileges of the shares of Class A Common Stock presently authorized. Therefore, approval of this proposal and any subsequent issuance of additional shares of Class A Common Stock would not affect your current rights as a shareholder, except for any dilutive effects of a potential increase in the number of outstanding shares of Class A Common Stock to, among other things, earnings per share, book value per share and the voting power of current holders of our Class A Common Stock.
Reasonsfirm for the Proposal
Our Board believes that the number of shares of Class A Common Stock that is available for issuance is not sufficient. We are currently authorized to issue 200,000,000 shares of Class A Common Stock. As of November 1, 2012, 118,362,931 shares of Class A Common Stock were issued and outstanding and 73,181,095 shares of Class A Common Stock were reserved (1) for conversions of our Class B Common Stock into shares of Class A Common Stock, (2) for the issuance upon exercise of outstanding stock options and stock awards, (3) for stock options and stock awards that may be granted in the future under our stock option or other incentive programs and (4) for stock that may be issued upon settlement or exchange of our outstanding equity-linked securities. As a result, there are currently only 8,455,974 shares of Class A Common Stock available, including shares held in Treasury, for other purposes.
The Board believes that it is advisable and in the Company’s and its shareholders’ best interests to have a greater number of authorized shares of Class A Common Stock in order to maintain the Company’s flexibility to use its capital stock for business and financing purposes in the future. The additional shares will be available for issuance from time to time at the discretion of the Board, normally without further shareholder action (except as may be required for a particular transaction by applicable law, requirements of regulatory agencies or by NYSE rules), for any proper corporate purpose including, among other things, capital-raising and deleveraging transactions, investment opportunities, to issue under stock option or other incentive programs, to attract and retain talented personnel and for other value-creating opportunities and strategic transactions. The Board believes that the proposed increase in the Company’s authorized Class A Common Stock will provide a sufficient number of shares available to maintain the flexibility necessary to pursue the foregoing and other opportunities in the foreseeable future.
The Board believes that prudent corporate governance includes the Company having a sufficient number of authorized but unissued shares of Class A Common Stock available for various purposes, and the Board regularly evaluates the Company’s needs and opportunities to utilize shares of the Company’s Class A Common Stock. In recent years, the Company has been focused on evaluating its debt profile, capital structure and various financing and refinancing alternatives and has successfully completed several deleveraging transactions, including with issuances of Class A Common Stock and securities which may be settled or exchanged for Class A Common Stock. These issuances represent the primary use of the Class A Common Stock over the past few years.
The Company has no current plans, and there are currently no agreements or arrangements to issue any of the additional shares of Class A Common Stock that would be authorized by the proposed Class A Amendment. However, if shareholders approve the proposed Class A Amendment, the additional authorized shares would give the Board more flexibility in responding to a variety of corporate opportunities, including those discussed above, which, if they become available, are likely to require prompt action on our part. The Board believes that the increase in the authorized number of shares of Class A Common Stock will enable the Company to take timely advantage of market conditions and the availability of favorable opportunities without the delay and expense associated with convening a special meeting to obtain shareholder approval at that time (unless otherwise required by regulatory agencies or by NYSE rules).
year ending October 31, 2015.PROPOSAL 3—1 The Company will have the authority to issue a total of 460,100,000 shares of all classes of stock if Proposal 4 is also approved.
2 The Company will have the authority to issue a total of 60,000,000 shares of Class B Common Stock if Proposal 4 is approved.
Possible Effects of the Increase in Class A Common Stock
The Company has not proposed the increase in the number of authorized shares of Class A Common Stock with the intent of using the additional shares to prevent or discourage any actual or threatened takeover of the Company. The Company currently has in effect a shareholder approved rights plan that is not designed to protect shareholders against the possibility of a hostile takeover. Instead, it is meant to preserve shareholder value and the value of certain tax assets primarily associated with net loss carryforwards and built-in losses under Section 382 of the Internal Revenue Code of 1986, as amended. The proposed Class A Amendment does not change any of the existing terms of the rights plan.
The increase in the authorized number of shares of Class A Common Stock and the subsequent issuance of such shares could, however, have the effect of delaying or preventing a change of control of the Company without further action by shareholders. Shares of authorized and unissued Class A Common Stock could (within the limits imposed by applicable law) be issued in one or more transactions that could make a change of control of the Company less likely. The additional authorized shares could be used to discourage persons from attempting to gain control of the Company by diluting the voting power of shares then outstanding or by increasing the voting power of persons who would support the Board in a potential takeover scenario. However, this proposal is not made in response to any effort of which we are aware to accumulate our stock or to obtain control of us, nor do we have a present intent to use the additional shares of authorized Class A Common Stock to oppose a hostile takeover attempt or to delay or prevent changes in control of management. In addition, members of the Hovnanian family, including Ara Hovnanian, the Chairman of our Board, President and Chief Executive Officer, have the power to cast a majority of the votes that can be cast by the holders of all our currently outstanding common stock, voting together, through personal holdings, the Limited Partnership, family trusts and shares held by the Estate of Kevork S. Hovnanian.
You will not realize any dilution in your percentage ownership or your voting rights as a result of increasing our authorized Class A Common Stock. In the absence of future issuances of our Class A Common Stock to you, issuances of additional shares of our Class A Common Stock in the future would dilute your percentage ownership and the voting power of the outstanding shares of our Class A Common Stock. In addition, the issuance of additional shares of our Class A Common Stock (or even the potential issuance) may have a depressive effect on the market price of our Class A Common Stock. Shareholders do not have preemptive rights, which means that they do not have the right to purchase shares in any future issuance of Class A Common Stock in order to maintain their proportionate equity interests in the Company.
VOTE REQUIRED
Approval of the proposed amendment to the Certificate of Incorporation to increase the number of authorized shares of Class A Common Stock requires the affirmative vote of the holders, represented in person or by proxy at the 2013 Annual Meeting, of (1) a majority of the votes cast by the shareholders of Class A Common Stock and Class B Common Stock, voting together, and (2) a majority of the votes cast by the shareholders of Class A Common Stock. In determining whether this proposal has received the requisite number of affirmative votes, abstentions will have no effect on the outcome because they are not considered votes cast. Approval of the Class A Amendment is not conditioned on the approval of the Class B Amendment described in Proposal 4.
If our shareholders approve the proposed Class A Amendment, it will become effective upon filing of an Amended and Restated Certificate of Incorporation with the Delaware Secretary of State, which we anticipate doing as soon as practicable following shareholder approval. However, if our shareholders approve the proposed Class A Amendment, our Board retains discretion under Delaware law not to implement the proposed amendment. If our Board were to exercise such discretion, the number of authorized shares of Class A Common Stock would remain at current levels.
Mr. Hovnanian and others with voting power over the shares held by the Estate of Kevork S. Hovnanian, the Limited Partnership and certain family trusts have informed the Company that they intend to vote in favor of this proposal.
Our Board of Directors recommends that shareholders vote FOR the approval of the proposed amendment to our Certificate of Incorporation to increase the number of authorized shares of Class A Common Stock.
(4) APPROVAL OF AN AMENDMENT TO THE COMPANY’S CERTIFICATE OF INCORPORATION TO INCREASE THE NUMBER OF AUTHORIZED SHARES OF CLASS B COMMON STOCK
On December 14, 2012, subject to shareholder approval, the Board authorized an amendment to our Certificate of Incorporation to increase the number of authorized shares of Class B Common Stock (the “Class B Common Stock”) from 30,000,000 shares to 60,000,000 shares (the “Class B Amendment”). Pursuant to Proposal 3, we are separately proposing an increase to our authorized Class A Common Stock, but we are not proposing an increase to the number of authorized shares of Preferred Stock.
If approved by shareholders, the Class B Amendment would be reflected in an Amended and Restated Certificate of Incorporation of Hovnanian Enterprises, Inc., and the first paragraph of paragraph Fourth of our Certificate of Incorporation would be amended to provide as follows:
“FOURTH: The total number of shares of all classes of stock which the Corporation shall have the authority to issue is 260,100,0003 shares, of which 200,000,0004 shares shall be Class A Common Stock having a par value of one cent ($0.01) per share, 60,000,000 shares shall be Class B Common Stock having a par value of one cent ($0.01) per share and 100,000 shares shall be Preferred Stock having a par value of one cent ($0.01) per share.”If the shareholders approve the proposed amendment, it will become effective upon filing of an Amended and Restated Certificate of Incorporation with the Delaware Secretary of State, which the Company anticipates doing as soon as practicable following shareholder approval.
The newly authorized shares of Class B Common Stock will have all the rights and privileges of the shares of Class B Common Stock presently authorized. Therefore, approval of this proposal and any subsequent issuance of additional Class B Common Stock would not affect your current rights as a shareholder, except for any dilutive effects of a potential increase in the number of outstanding shares of Class B Common Stock to, among other things, earnings per share, book value per share and the voting power of holders of our Class B Common Stock.
Reasons for the Proposal
The Company is a family enterprise that has been in operation since 1959, and the Company has maintained a shareholder approved dual-class capital structure since 1992. The Board established this structure as part of its philosophy to foster continuity and stability in the Company’s operations.
The Board continues to believe that it important to the Company’s continued and future development to provide for continuity of direction and management and to maintain stability in the Company’s relationships with its lenders, suppliers, contractors and others who are important to the conduct of the Company’s business. The Board also believes that the Hovnanian family’s direction and management of the Company and the stability in the Company’s relationships with others fostered by their control have been crucial to the growth and success of the Company over its history and will continue to be so in the future.
In light of the benefits to the Company of the continuity of share ownership and control of the Hovnanian family, the Board believes that it is advisable and in the best interests of the Company and its shareholders to maintain the relative proportion of the Class B Common Stock to the Class A Common Stock. If Proposal 3 is approved, we would be authorized to issue 400,000,000 shares of Class A Common Stock. Therefore, approval of the Class B Amendment would maintain the proportion of authorized Class A Common Stock and Class B Common Stock as it currently stands and enable the Company to pursue the initiatives described in Proposal 3.
3 The Company will have the authority to issue a total of 460,100,000 shares of all classes of stock if Proposal 3 is also approved.
4 The Company will have the authority to issue a total of 400,000,000 shares of Class A Common Stock if Proposal 3 is approved.
The Company has historically issued Class B Common Stock to the Hovnanian family in connection with equity awards and with the anticipation that the Class B Common Stock would be held for investment. Under the terms of the Company’s Certificate of Incorporation, transfers of Class B Common Stock are restricted to certain permitted transferees (otherwise each share of Class B Common Stock would be converted into Class A Common Stock on a share-for-share basis) and, if the Class B Common Stock is held in nominee name, the beneficial owner of the Class B Common Stock is required to make representations that such holder has held continuously since the date of issuance in order to receive the benefit of the Class B Common Stock voting. Absent such representations, each share of Class B Common Stock would carry the same number of votes as a share of Class A Common Stock.
Possible Effects of the Increase in Class B Common Stock
The Company has not proposed the increase in the number of authorized shares of Class B Common Stock with the intent of using the additional shares to prevent or discourage any actual or threatened takeover of the Company. The Company currently has in effect a shareholder approved rights plan that is not designed to protect shareholders against the possibility of a hostile takeover. Instead, it is meant to preserve shareholder value and the value of certain tax assets primarily associated with net loss carryforwards and built-in losses under Section 382 of the Internal Revenue Code of 1986, as amended. The proposed Class B Amendment does not change any of the existing terms of the rights plan.
The increase in the authorized number of shares of Class B Common Stock and the subsequent issuance of such shares could, however, have the effect of delaying or preventing a change of control of the Company without further action by shareholders. Shares of authorized and unissued Class B Common Stock could (within the limits imposed by applicable law) be issued in one or more transactions that could make a change of control of the Company less likely. The additional authorized shares could be used to discourage persons from attempting to gain control of the Company by diluting the voting power of shares then outstanding or by increasing the voting power of persons who would support the Board in a potential takeover scenario. However, this proposal is not made in response to any effort of which we are aware to accumulate our stock or to obtain control of us, nor do we have a present intent to use the additional shares of authorized Class B Common Stock to oppose a hostile takeover attempt or to delay or prevent changes in control of management. In addition, members of the Hovnanian family, including Ara Hovnanian, the Chairman of our Board, President and Chief Executive Officer, have the power to cast a majority of the votes that can be cast by the holders of all our currently outstanding common stock, voting together, through personal holdings, the Limited Partnership, family trusts and shares held by the Estate of Kevork S. Hovnanian.
You will not realize any dilution in your percentage ownership or your voting rights as a result of increasing our authorized Class B Common Stock. Issuances of additional shares of our Class B Common Stock in the future would dilute your percentage ownership and the voting power of the outstanding shares of our Class A Common Stock. In addition shareholders do not have preemptive rights.
VOTE REQUIRED
Approval of the proposed amendment to the Certificate of Incorporation to increase the number of authorized shares of Class B Common Stock requires the affirmative vote of the holders, represented in person or by proxy at the 2013 Annual Meeting, of (1) a majority of the votes cast by the shareholders of Class A Common Stock and Class B Common Stock, voting together, and (2) a majority of the votes cast by the shareholders of Class B Common Stock. In determining whether this proposal has received the requisite number of affirmative votes, abstentions will have no effect on the outcome because they are not considered votes cast. Approval of the Class B Amendment is not conditioned on the approval of the Class A Amendment described in Proposal 3.
If our shareholders approve the proposed Class B Amendment, it will become effective upon filing of an Amended and Restated Certificate of Incorporation with the Delaware Secretary of State, which we anticipate doing as soon as practicable following shareholder approval. However, if our shareholders approve the proposed Class B Amendment, our Board retains discretion under Delaware law not to implement the proposed amendment. If our Board were to exercise such discretion, the number of authorized shares of Class B Common Stock would remain at current levels.
Mr. Hovnanian and others with voting power over the shares held by the Estate of Kevork S. Hovnanian, the Limited Partnership and certain family trusts have informed the Company that they intend to vote in favor of this proposal. Because of their collective voting power, this proposal is assured passage.
Our Board of Directors recommends that shareholders vote FOR the approval of the proposed amendment to our Certificate of Incorporation to increase the number of authorized shares of Class B Common Stock.
(5) VOLUNTARY ADVISORY VOTE ON EXECUTIVE COMPENSATION
In accordance with the requirements of Section 14A of the Exchange Act (which was added by the Dodd-Frank Wall Street Reform and Consumer Protection Act (the “Dodd-Frank Act”))Act) and the related rules of the SEC, we are including in these proxy materials a separate resolution subject to shareholder vote to approve, in a non-binding vote, the compensation of our named executive officers, as disclosed on pages 1814 to 50.
52.In light of the voting results with respect to the frequency of shareholder votes on executive compensation at the 2011 Annual Meeting of Shareholders in which a substantial majority of our shareholders (96.3% of the votes cast by shareholders of Class A Common Stock and Class B Common Stock, voting together) voted for “say-on-pay” proposals to occur every three years, the Board of Directors initially decided that the Company would hold, in accordance with the vote of an overwhelming majority, a triennial advisory vote on the compensation of named executive officers, whichofficers. The next required “say-on-pay” vote would nextwill take place at the Company’s 20142017 Annual Meeting of Shareholders. However,Shareholders; however, we have voluntarily elected to hold our nexta “say-on-pay” vote at this 20132015 Annual Meeting of Shareholders.
In considering their vote, shareholders may wish to review with care the information on the Company’s compensation policies and decisions regarding the named executive officers presented in Compensation Discussion and Analysis on pages 1814 to 36,34, as well as the discussion regarding the Compensation Committee on pages 16 and 17.
12 to 14.As we discuss in the Compensation Discussion and Analysis section, the Board of Directors believes that the Company’s long-term success depends in large measure on the talents of the Company’s employees. The Company’s compensation system plays a significant role in the Company’s ability to attract, retain and motivate the highest quality associates in a difficult market. The principal underpinnings of the Company’s compensation system are an acute focus on performance, shareholder alignment, sensitivity to the relevant market place and a long-term orientation.
The Compensation Committee ties increases or decreases in overall compensation with the overall financial performance of the Company. During fiscal years when the Company’s profitability has been higher, total compensation has been higher. During more recent years when the Company’s performance has been lower due in part to the economic downturn and recession, particularly in the housing industry, the Compensation Committee’s policies and actions have significantly lowered overall compensation. These policies and actions include:
include the following. | ·● | Significant reductions in annual bonus opportunity,opportunities, where, on average, the maximum award for fiscal 2014 for all named executive officers is(“NEOs”) was approximately 92%79% lower than the maximum award received during the last ten years and approximately 39% lower thanyears. |
| ● | Selection of bonus metrics to correspond to the maximum awardfinancial needs of the Company during the last four years;relevant period. During periods of profitability, the bonus metrics were focused on profitability and return on shareholders’ equity measures. During periods when there was little or no likelihood of profits, bonus metrics were focused on reducing the Company’s debt obligations and improving cash flow and liquidity to enable the Company to weather the difficult economic conditions and return to profitability. |
| ·● | Focus on improving EBITDA through a bonus component for our Chairman of the Board, President and Chief Executive Officer, our Executive Vice President and Chief Financial Officer and our Chief Operating Officer that is only earned if EBITDA improvement performance goals are met; |
| · | Focus on a return to profitability and lowering net debt or refinancing debt over a three-yearmulti-year performance periodperiods through a long-term incentive awardawards for all named executive officersNEOs in fiscal 2010;2010 and fiscal 2013. |
| ·● | PolicyPractice of generally targeting a fixed numbertying portions of stock options rather than a specific option value as partequity awards to performance criteria. For example, in fiscal 2014, the Chairman of the annual compensation program (sinceBoard, President and Chief Executive Officer (the “CEO”), the numberExecutive Vice President and Chief Financial Officer (the “CFO”) and the Chief Operating Officer (the “COO”) were granted Market Share Units (“MSUs”). This award type, which we have not used previously, is tied to stock price performance. For the MSUs granted in fiscal 2014, 50% are subject to financial performance conditions in addition to the stock price performance conditions applicable to all of stock options generally was not increased as stock prices in the homebuilding industry declined, the valueMSU awards. Additional details are described below under “Compensation Discussion and Analysis – Details of stock option grants to our named executive officers has declined significantly); andCompensation Elements – Stock Grants.” |
| ·● | Reduction in shareholder dilution through the Compensation Committee’s activeActive management of both equity award levels and the number of shares available for new equityequity-based awards. |
The text of the resolution in respect of this proposal is as follows:
“Resolved, that the compensation paid to the Company’s named executive officers as disclosed pursuant to Item 402 of Regulation S-K in the Proxy Statement relating to the Company’s Annual Meeting of Shareholders to be held on March 12, 2013,10, 2015, including the Compensation Discussion and Analysis, compensation tables and narrative discussion, is hereby approved.”
The Board recommends that shareholders vote FOR approval of this resolution.
THE COMPENSATION COMMITTEE
The Compensation Committee of the Board of Directors (the “Committee”) is the principal overseer of the Company’s various policies and procedures related to executive compensation. The Committee meets at least four times a year to discuss industry trends with regard to overall compensation issues and consults with outside compensation consultants as needed. The Committee is governed by its Charter, which is available on the Company’s public website (www.khov.com)at www.khov.com under “Investor Relations/Corporate Governance”.
The Committee, in conjunction with the Board of Directors and with management’s input, shapes the Company’s executive compensation philosophy and objectives. In particular, the Committee is charged with:
| ·● | Reviewing and approving, at least annually, the salaries, bonuses and other forms of compensation, including stock optionequity grants, for the Company’s senior executives (which include the Chairman of the Board, President and Chief Executive Officer (the “CEO”), the Executive Vice President and Chief Financial Officer (the “CFO”), the Chief Operating Officer (the “COO”)CEO, CFO, COO and the other named executive officers (“NEOs”)NEOs for whom compensation is reported in the tables below); |
| ·● | Reviewing, at least annually, compensation paid to the Company’s non-employee Directors; |
| ·● | Participating in the review of compensation of other designated key employees of the Company; |
| ·● | Periodically reviewing the Company’s policies and procedures pertaining to the Company’s equity award plans and forms of equity grants to all employees and non-employee Directors, employee benefit plans (for example, the 401(k) plan and deferred compensation plans), severance agreements and executive perquisites, and forms of equity grants to all employees and non-employee directors;perquisites; |
| ·● | Fostering good corporate governance practices as they relate to executive compensation; and |
| ·● | Reviewing, at least annually, as part of the Board of Directors’ oversight responsibilities, the Company's compensation program and reports from the Company’s CFOmanagement regarding hisits assessment of whether there are any compensation risks that are reasonably likely to result in a material adverse effect on the Company (see "Oversight of Risk Management" below). In addition, the Committee regularly considers business and compensation risks as part of its process for establishing performance goals and determining incentive awards for each of the NEOs.NEOs; |
These | ● | Preparing the compensation committee report on executive compensation for inclusion in the Company’s annual proxy statement, in accordance with applicable rules and regulations of the NYSE, SEC and other applicable regulatory bodies; and |
| ● | Reviewing and discussing with management the “Compensation Discussion and Analysis” (the “CD&A”) for inclusion in the Company’s annual proxy statement and, based on that review and discussion, determining whether or not to recommend to the Board of Directors that the CD&A be included in the Company’s annual proxy statement. |
The Committee’s areas of responsibilities are discussed in more detail below under “Compensation Discussion and Analysis.” During the fiscal year ended October 31, 2012, the members of the Committee were all “non-employee directors” for purposes of Rule 16b-3 of the Exchange Act, and “outside directors” for purposes of Section 162(m) of the Internal Revenue Code of 1986, as amended.
Compensation Review Process for the Named Executive Officers
The Committee, in conjunction with the Board of Directors and with management’s input, is responsible for making decisions related to the overall compensation of the NEOs.
At least annually, the Committee establishes objective financial measures for determining bonus awards to the NEOs. The Committee also considers salary, employee benefits and discretionary bonus awards, if any, for the NEOs.
In determining overall compensation for the NEOs, the Committee may consult with other members of the Board of Directors, including the CEO and the CFO. Each of theseCFO, rather than relying solely on the Company’s financial performance measures in determining their compensation. These individuals often providesprovide the Committee with insight on the individual and overall performance of executives (other than with respect to himself), including the achievement of personal objectives, if any, rather than relying solely on the Company’s financial performance measures in determining their compensation.any. The CEO and CFO are not present for the Committee’s evaluation of their individual performance. The Committee also reviews and analyzes the compensation of the named executive officers of the Company’s peer group of 11 publicly-traded homebuilding companies (the “Peer Group”), discussed further below. The Committee may engage outside compensation consultants in relation to various compensation issues. The Committee may also instruct a compensation consultant to provide assistance in fostering an overall compensation program that aligns with its compensation philosophy to guide, motivate, retain and reward its executives for the achievement of the Company’s financial performance, strategic initiatives and individual goals, including increased long-term shareholder value in the context of a challenging business environment. Notwithstanding any input from compensation consultants, the Committee has the sole discretion to make all final decisions related to NEO compensation.
Outside Compensation Consultant and No Conflicts of Interest
For fiscal 2012,2014, the Committee engaged Pearl MeyerFrederic W. Cook & PartnersCo., Inc. (“PM&P”F.W. Cook”) as the Committee’s outside compensation consultant to provide certain services related to executive and non-employee Director compensation. PM&P does not provide any other services to the Company unless approved by the Committee, and no such services were provided in fiscal 2012. After considering the relevant factors, the Company has determined that no conflicts of interest have been raised in connection with the services PM&P performed for the Company in fiscal 2012. In fiscal 2012, PM&P2014, F.W. Cook assisted the Committee with its review of the Company’s annual bonus and long-term incentive plans for the NEOs as well as its review of the compensation program for the non-employee directors.
F.W. Cook does not provide any other services to the Company unless approved by the Committee, and no such services were provided in fiscal 2014. After considering the relevant factors, the Company has determined that no conflicts of interest have been raised in connection with the services F.W. Cook performed for the Company in fiscal 2014.The Committee’s primary objective in engaging PM&PF.W. Cook has been to obtain advice and feedback related to maintaining programs that provide compensation opportunities for executives within the median range of the competitive homebuilderPeer Group forcomparable financial performance and PM&Pperformance. F.W. Cook also provided assistance to the Committee in fostering an overall compensation program as discussed above.
The Committee weighs the advice and feedback from its compensation consultant and the members of the Board of Directors, as well as the views of, and information gathered by, the members of management it has consulted in conjunction with its review of other information the Committee considers relevant when making decisions or making recommendations to the full Board of Directors regarding executive compensation.
The Company’s Board of Directors is updated at least quarterly of any compensation decisions or recommendations made by the Committee, and the Committee requests feedback from the Board of Directors regarding specific compensation issues as it deems necessary.
Compensation Committee Report
The Committee has reviewed and discussed the Compensation Discussion and Analysis provided below with the Company’s management. Based on this review and discussion, the Committee recommended to the Board of Directors that the Compensation Discussion and Analysis be included in this proxy statementProxy Statement and in the Company’s Annual Report on Form 10-K for the fiscal year ended October 31, 2012.
2014.COMPENSATION COMMITTEE
Stephen D. Weinroth, Chair
Joseph A. Marengi
Compensation Committee Interlocks and Insider Participation
During the fiscal year ended October 31, 2012,2014, the members of the Compensation Committee were Messrs. Weinroth, Coutts, Kangas and Coutts.Marengi. Each of Messrs. Weinroth, Coutts, Kangas and Coutts areMarengi is a non-employee Directors, wereDirector, was never officersan officer or employeesemployee of the Company or any of its subsidiaries and did not have any relationships requiring disclosure under Item 404404(a) of Regulation S-K during fiscal 2012.in this Proxy Statement. None of our executive officers served on the board of directors or compensation committee of any other entity that has or had one or more executive officers who served on our Board of Directors or our Compensation Committee during fiscal 2012.
2014.COMPENSATION DISCUSSION AND ANALYSIS
Company Performance in Fiscal 2012
Beginning2014In fiscal 2014, the Company generated growth in revenues and achieved its second consecutive year of profitability. However, the significant market growth exhibited in the second quarter of fiscal 2012, the Company began to see positive operating trends, which continued into the third and fourth quarters of fiscal 2012.housing industry in 2013 moderated in 2014. Below are some highlights forof the Company’s performance during fiscal 2012:
2014: | ·● | Total revenues for fiscal 20122014 were $1.5$2.06 billion, up 30.9%11.4% from $1.1$1.85 billion during all of fiscal 2011;2013; |
| ·● | During fiscal 2012,2014, the dollar value of consolidated net contracts including unconsolidated joint ventures, increased 43.9%10.0% to $1.9$2.11 billion compared with $1.3$1.91 billion for fiscal 2011,2013, and the number of consolidated net contracts increased 30.1%slightly to 5,8385,559 homes for fiscal 2014 compared with 4,4885,544 homes in the previous year; |
| ·● | During fiscal 2012,2014, consolidated deliveries including those in our unconsolidated joint ventures, were 5,3565,497 homes compared with 4,2165,266 homes during fiscal 2011,2013, representing an increase of 27.0%4.4%; |
| ·● | ContractConsolidated contract backlog as of October 31, 2012, including that in our unconsolidated joint ventures,2014 was $742.2$855.8 million for 2,1452,229 homes, which was an increase of 34.4%12.3% and 29.0%2.9%, respectively, compared to October 31, 2011;2013; |
| ·● | During all of fiscal 2012,2014, homebuilding gross margin percentage, before interest expense and land charges included in cost of sales, was 17.8%19.9% compared with 15.6%20.1% in 2011;fiscal 2013; |
| ·● | During all of fiscal 2012,2014, total selling, general and administrative expenses were $190.3$254.9 million, or 12.8%12.4% of total revenues, compared with $211.4$220.2 million, or 18.6%11.9% of total revenues, for fiscal 2011;2013; |
| ·● | The Company refinanced $797Pre-tax profit for fiscal 2014 was $20.2 million compared with pre-tax profit of $21.9 million for fiscal 2013; |
| ● | A non-cash tax benefit of $285.1 million from the reduction of the Company’s valuation allowance for its deferred tax assets was included in net income for fiscal 2014; |
| ● | Net income for fiscal 2014 was $307.1 million, or $1.87 per fully diluted common share, compared with net income of $31.3 million, or $0.22 per fully diluted common share for fiscal 2013; and |
| ● | Total liquidity as of October 31, 2014 was $309.2 million compared to $373.5 million as of October 31, 2013. Total liquidity as of October 31, 2014 included $255.1 million of securedhomebuilding cash, $5.6 million of restricted cash required to collateralize letters of credit and $48.5 million of availability under the unsecured revolving credit facility. Total liquidity pro forma for the $250.0 million senior notes during the fourth quarteroffering in November 2014 would have been $554.9 million as of fiscal 2012, which reduces annual cash interest payments by approximately $17 million and extends the maturity of the refinanced debt from 2016 until 2020; andOctober 31, 2014. |
Best Practices
| ·● | The fiscal year-end closing price of a share of Class A Common Stock increased 199% compared to 2011. |
Best Practices
| · | Pay-for-Performance: The Compensation Committee (“Committee”) ties increases or decreases in overalltotal compensation with the overall financial performance of the Company. During fiscal years when the Company’s profitability has been higher, total compensation has been higher. During more recent years when the Company’s performance has been lower due in part to the economic downturn and recession, which ishas been particularly significant in the housing industry, the overalltotal compensation has been lower. The Committee seeks to motivate management to achieve improved financial performance of the Company through bonus plans that reward higher performance with increased bonus opportunities. In its selection ofbonuses. The metrics the Committee has selected to measure bonus achievement the Committee has selected metrics to correspondhave corresponded to the financial needs of the Company during the relevant period. During periods of profitability, the bonus metrics were focused on profitability and return on shareholders’ equity measures. During recent periods when there was little or no likelihood of profits, bonus metrics were focused on opportunities that would reducereducing the Company’s debt obligations and improveimproving cash flow and liquidity to enable the Company to weather the difficult economic conditions and return to profitability. |
The following graph demonstrates the link between the CEO’s annual realized pay and the Company’s Total Shareholder Return (“TSR”). Annual realized pay includes: (1) base salary, annual bonus, perquisites and other compensation (“Annual Compensation”) plus (2) long-term cash awards and stock awards vesting during the fiscal year and the realized value of options exercised during the year (“Realized Value of Long-Term Compensation”).
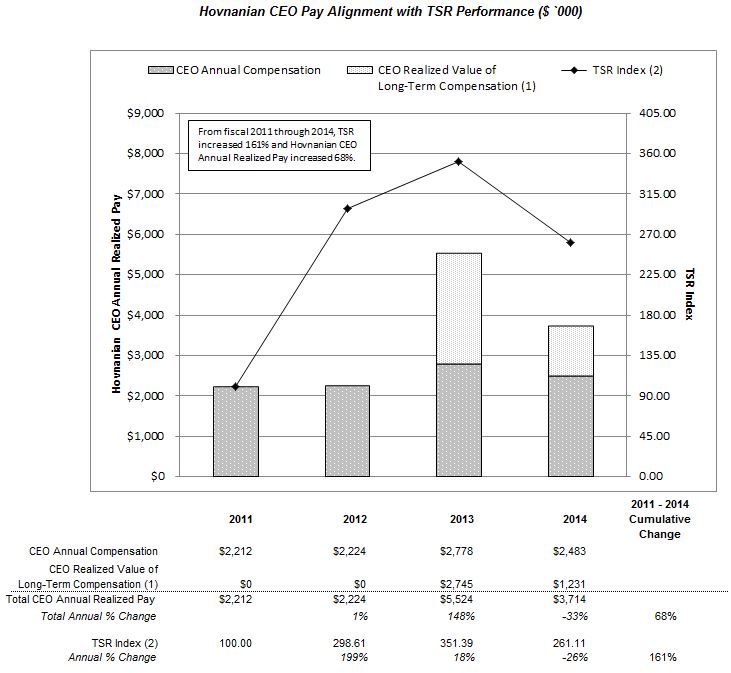
| (1) | Represents the value of (1) the 2010 Long-Term Incentive Program award for performance during fiscal 2011, 2012 and 2013, which vested during fiscal 2013 and 2014 and (2) the June 10, 2011 restricted stock unit award (the only restricted stock unit award vesting in these years) for performance during fiscal 2012 and 2013, which vested during fiscal 2013 and 2014. The CEO did not exercise any stock options during the fiscal 2011 through 2014 period. |
| | | The following graph demonstrates the link between the CEO’s annual realized pay and the Company’s Total Shareholder Return (“TSR”). Annual realized pay includes salary, annual bonus, perquisites and other compensation plus the realized value of options exercised and shares vesting during the fiscal year. |
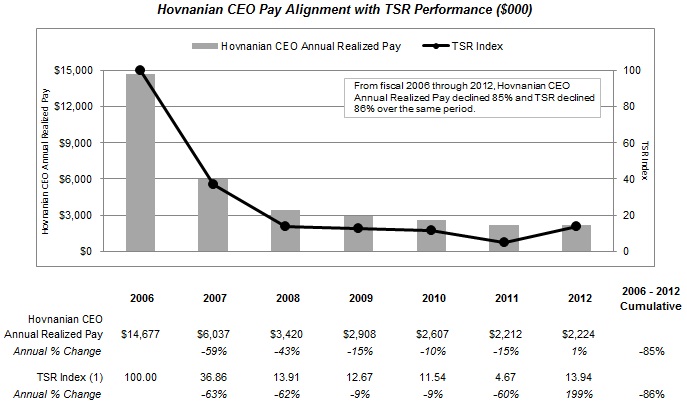
| | (1)(2) | The TSR Index measures the change in the Company's stock price relative to fiscal 2006.2011. The index for each fiscal year is determined by comparing the fiscal year-ending stock price to the ending stock price in fiscal 20062011 which is set at 100. |
| ·● | Emphasis on Long-Term Value Creation and Retention: The Committee seeks to align the interests of management with the long-term interests of the Company’s shareholders by granting a significant portion of thetheir total compensation in the form of stock optionsequity that increaseincreases in value as the Company’s financial performance improves. The Committee also seeks to retain management through the utilization ofby using compensation methods that require executives to be employed through various vesting periods in order to receive the full financial benefits of stock optionequity grants that vest over multiple years deferred shares as part of an annual bonus, and awards under the Long-Term Incentive Programlong-term incentive programs implemented in fiscal 2010.2010 and 2013. |
| ·● | Maintaining an Appropriate Peer Group: In constructing the Peer Group described below, the Committee selected those companies that compete directly with the Company in the homebuilding industry, are of comparable size and complexity in operations to the Company and are generally in the markets in which the Company competes. The Committee reviews the composition of the Peer Group on an annual basis and makes adjustments, if needed. The Committee reviews the executive compensation of the Peer Group companies and seeks to award target total direct compensation (the sum of base salary, annual bonus/incentive awards and long-term incentive awards (including the grant date fair value of equity awards and the annualized value of long-term incentive program awards at the target outcome for the performance criteria), but excluding all other compensation elements) opportunity for our NEOs near the median of the Peer Group, with variation in actual compensation earned both above and below the median, depending on performance. |
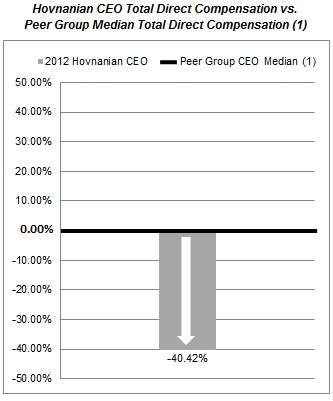
| ● | CEO Total Direct Compensation vs. Peer Group: The following graphs compare the CEO’s total direct compensation to the Peer Group chief executive officer median data for fiscal 2011 through 2013. No comparison is shown for fiscal 2014 because complete Peer Group chief executive officer median data was not available at the time of filing this Proxy Statement. For fiscal 2014, our CEO’s base salary was $1.1 million, his bonus was $1.1 million and his long-term incentive awards (including the grant date fair value of MSUs and the annualized value of long-term incentive program awards at the target outcome for the performance criteria) were $4.7 million. |
| | |
| | Hovnanian CEO Total Direct Compensation vs. Peer Group CEO Median Total Direct Compensation (1)(2) ($`000)
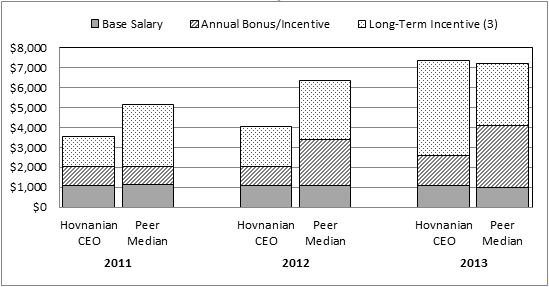 |
| (1) | Reflects the sum of base salary, annual bonus/incentive awards and long-term incentive awards (including thegrant date fair value of equity awards and theannualized value of long-term incentive program awards at the target outcome for the performance criteria) and excludes all other compensation elements. |
| | ·(2) | Data shown is based on each Peer Group company’s respective fiscal year which varies among Peer Group companies and, consequently, may be different than the Company’s fiscal year. |
| (3) | Long-term incentives include the grant date fair value of equity awards and the annualized value of long-term incentive program awards at the target outcome for the performance criteria. |
Hovnanian CEO Total Direct Compensation vs.
Peer Group CEO Median Total Direct Compensation (1)(2)

| (1) | Reflects the sum of base salary, annual bonus/incentive awards and long-term incentive awards (including thegrant date fair value of equity awards and theannualized value of long-term incentive program awards at the target outcome for performance criteria) but excludes all other compensation elements. |
| (2) | Data shown is based on each Peer Group company’s respective fiscal year which varies among Peer Group companies and, consequently, may be different than the Company’s fiscal year. |
| ● | No Employment Agreements, Excise Tax Gross-Ups SERPs or Defined Benefit Plans: The Company does not maintain employment or other agreements that provide contractual rights to employees upon termination of employment (other than upon death or disability), except for the change in control severance agreements the Company entered into with Messrs. O’Connor and Valiaveedan in January 2012 discussed below and in footnote (5) to the “Potential Payments Upon Termination Oror Change-In-Control Table,” and the vesting of equity-based awards in the case of retirement or in connection with a qualifying termination in case of a change in control. The Company does not provide excise tax gross-ups supplemental executive retirement plans or defined benefit pension plans for any NEOs. |
| ·● | Maintenance and EnforcementMonitoring of Stock Ownership Guidelines: The Board of Directors has established stock ownership guidelines pursuant to which the CEO, CFO and COO are requested to achieve and maintain recommended minimum levels of stock ownership as set forth below under “Stock Ownership Guidelines.” |
| ·● | Perquisites: The Committee has provided NEOs only a few perquisites in addition to typical medical, dental and life insurance benefits. The Company limits the personalPersonal use of Company automobiles and its fractional aircraft share, reimbursement for country club dues and personal income tax preparation and accounting services are limited to the CEO. Our perquisites do not includeThere are no tax gross-ups on any tax gross-ups.of our perquisites. |
| ● | Clawback Policy: Under Section 304 of the Sarbanes-Oxley Act of 2002, if we are required to restate our financial results due to material noncompliance with any financial reporting requirements as a result of misconduct, the CEO and CFO could be required to reimburse us for any bonus or other incentive-based or equity-based compensation received during the 12 months following the first public issuance of the non-complying document and any profits realized from the sale of our securities during those 12 months. In addition to this requirement, it is the Company’s policy that, if we are required to restate our financial results due to material noncompliance by the Company with any financial reporting requirement under the securities laws as a result (directly or indirectly) of an executive officer’s misconduct, the Board of Directors will require, at its discretion and approval, the reimbursement and/or cancellation of any incentive-based compensation (including stock options awarded as compensation) in excess of the amount that would have been awarded based on the restated financial results. This policy applies to incentive-based compensation awarded to the executive officer during the three-year period preceding the date on which the Company is required to prepare an accounting restatement based on erroneous data. |
Compensation Decisions for Fiscal 2012
2014The Committee’s compensation decisions for fiscal 20122014 reflected a conservative approach to fixed pay elements (base salary), the achievement of pre-established goals (annual bonuses) and long-term equity awards well below median of the Peer Group in view of the challenging business environment and the Company’s stock performance in such environment.
awards. | ·● | Base Salaries: For the eighth year in a row, the Committee did not increase the CEO’s base salary. The CEO and CFO received noCommittee approved a 3% base salary increase, which was effective December 21, 2013, for fiscal 2012. The remaining three NEOs received a salary increase. In December 2011, the Committee approved fiscal 2012 increases foreach of Messrs. Sorsby, Pellerito, Valiaveedan and O’Connor. The increases for Messrs. PelleritoO’Connor and Valiaveedan were approved in order to move them closer to the Peer Group medianconsideration of their individual performance and in the case of Mr. Valiaveedan, to further align himline with the median level for the broad-based compensation survey data (as described further under “Compensation PhilosophyCompany’s ordinary course merit-based salary and Objectives – Peer Group Considerations”). Mr. O’Connor received ancost of living increase as a result of his promotion to Vice President — Chief Accounting Officer and Corporate Controller.practices. See “Details of Compensation Elements – Base Salaries” below for additional information on base salaries. |
| ·● | Regular Annual Bonuses: Consistent with the achievement of specified financial or personal objectives, fiscal 20122014 annual bonuses were paid to all NEOs. Bonuses for the CEO, CFO and COO, however, were lower than in fiscal 2013 because the Company did not achieve at least a 20% improvement in Pre-tax Profit (as defined below) compared to fiscal 2013, which was required in order for these NEOs to be eligible to earn the same bonuses as forthey did in fiscal 2011.2013. Bonuses for the other NEOsMessrs. O’Connor and Valiaveedan each increased 3%, which was in proportion to the amount of their annual salary increases, asbecause they again achieved maximum performance under the personal objectives component of their respective bonus calculations are a percentage of base salary.formulas. Additional details are described below under “Details of Compensation Elements – Annual Bonuses – Regular Bonuses.” |
| ·● | Discretionary Bonuses: Discretionary The Committee did not award discretionary bonuses were awarded to Mr. O’Connor and Mr. Valiaveedan inany NEO for fiscal 2013 in respect of their performance in fiscal 2012, as described further under “Details of Compensation Elements – Annual Bonuses – Discretionary Bonuses.”2014. |
| ·● | Long-Term Awards, including stock options, market share units and participation in the Long-Term Incentive Program (described below): Grants of equity awards made to NEOs in fiscal 2012 and the annualized target value of the Company’s Long-Term Incentive Program fell considerably below median Peer Group long-term incentive compensation levels. The Long-Term Incentive Program was implemented in fiscal 2010 as a multi-year award with a three-year performance period (fiscal 2011-2013), with additional vesting conditions indescribed below: For fiscal 2014, and 2015. In fiscal 2012, the Committee determined that stock options granted in June 2012 to the CEO, CFO and COO would have an exercise price 33 1/3% aboveawards in the closingform of MSUs rather than stock price onoptions, although the grant date. In determining to granttarget number of shares underlying the MSU awards for fiscal 2014 and the target number of shares underlying the stock options with an exercise price at this premium level,for fiscal 2013 remained the Committee sought to provide a stronger link with increased shareholder value, as these executives have more significant responsibility for the Company’s long-term strategy as compared to the other NEOs.same. The Committee also determined to increase the number of options awarded in recognitionthat 50% of the premium pricing and its determination thatMSUs would be subject to financial performance conditions in addition to the CEO, CFO and COO’s long-term incentive values on the grant date (including recent annual option grants and the annualized fiscal 2010 valuestock price performance conditions applicable to all of the LTIP at target, discussed below) were considerably belowMSU awards. These additional performance-based MSUs will not vest unless the median value of long-term incentive awards granted to the Peer Group chief executive officers, chiefspecific financial officers and chief operating officers. Additional details areperformance conditions described below under “Details of Compensation Elements – Stock Grants.” |
| · | ChangeGrants” are met. Mr. O’Connor received the same number of stock options as in Controlfiscal 2013 and Severance Agreements: In January 2012, the Company entered into changeMr. Valiaveedan’s grant increased from 15,000 stock options in control severance protection agreements with Messrs. O’Connor and Valiaveedan.fiscal 2013 to 20,000 stock options in fiscal 2014 (as discussed below under “Details of Compensation Elements – Stock Grants”). The Committee considers the continued services of these key executives whose skills are not specifically tied to the homebuilding industry to be in the best interests of the Company and its shareholders. The agreements are designed to reinforce and encourage their continued attention and dedication to their duties of employment without personal distraction or conflict of interest in circumstances which could arise from the occurrence of a change in control of the Company. These agreements provide benefits following a change in control only if the executive is terminated involuntarily or terminates with Good Reason. Neither of these agreements provide for excise tax gross-ups. The provisions of such agreements are2013 LTIP, described below under “Potential Payments Upon Termination Or Change-In-Control Table.“Details of Compensation Elements,”
|
| · | Impact on CEO Total Direct Compensation: The following graphs compare was implemented in fiscal 2012 CEO total direct compensation (the sum of base salary, annual bonus/incentive2013 as a multi-year award with a 31-month performance period and long-term incentive awards, excluding all other compensation elements) to the most recently published Peer Group median data available to the Committee when finalizing fiscal 2012 CEO compensation.
|

| (1) | Reflects the most recently published Peer Group Median data available to the Committee when finalizing fiscal 2012 CEO compensation. Note that the annual incentive and long-term incentive compensation levelsadditional vesting conditions for two offiscal years beyond the eleven peer group CEOs reflected in the Peer Group Median were substantially lower than their prior year levels because these CEOs were no longer serving in such positions during or just after the end of the year for which the data was gathered. Had these two CEOs been excluded from the Peer Group CEO Median, the Peer Group CEO Median would have been higher and, consequently, the CEO’s Total Direct Compensation would have been further below the Peer Group CEO Median Total Direct Compensation.performance period. |
| (1) | Reflects the most recently published Peer Group Median data available to the Committee when finalizing fiscal 2012 CEO compensation. Note that the annual incentive and long-term incentive compensation levels for two of the eleven peer group CEOs reflected in the Peer Group Median were substantially lower than their prior year levels because these CEOs were no longer serving in such positions during or just after the end of the year for which the data was gathered. Had these two CEOs been excluded from the Peer Group CEO Median, the Peer Group CEO Median would have been higher and, consequently, the CEO’s Total Direct Compensation would have been further below the Peer Group CEO Median Total Direct Compensation. |
2. COMPENSATION PHILOSOPHY AND OBJECTIVES
The Committee, in conjunction with the Board of Directors and with senior management, has been instrumental in shaping the Company’s compensation philosophy and objectives because of its responsibilities and oversight of the Company’s various policies and procedures concerning executive compensation.
The six primary objectives that the Committee considers in making compensation decisions are discussed below, as are our other philosophies and mechanisms for determining compensation. In making compensation-related decisions, the Committee also considered its role in promoting good corporate governance practices.
Primary Objectives for the Compensation Program
The Company’s primary objectives for compensating its executives are as follows:
| 1. | To fairly compensate its executives in a manner that is appropriate with respect to their performance, level of responsibilities, abilities and skills; |
| 2. | To offer compensation that guides, motivates, retains and rewards its executives for the achievement of the Company’s financial performance, strategic initiatives and individual goals; |
| 3. | To align the executive’s interests with the interests of theour shareholders; |
| 4. | To maintain competitive pay opportunities for its executives so that it retains its talent pool and, at the same time, has the ability to attract new and highly-qualified individuals to join the organization as it grows or in the event of succession or replacement of an executive; |
| 5. | To safeguard that the reward system is appropriately designed in the context of a challenging business environment; and |
| 6. | To ensure that compensation plans do not incentivize a level of risk that is reasonably likely to have a material adverse effect on the Company. |
Tailored Compensation
Consistent with these objectives, the Company’s compensation philosophy also takes into consideration the very unique roles played by each of the NEOs for whom compensation is reported in the tables below, and the Committee seeks to individually tailor their compensation packages to align their pay mix and pay levels with their contributions to, and positions within, the Company. For example:
| ·● | CEO, CFO and COO: The compensation packagepackages of the CEO, Mr. Ara K. Hovnanian, the CFO, Mr. J. Larry Sorsby, and the COO, Mr. Thomas J. Pellerito, differ from that of the other NEOs due to their unique roles and elevated set of responsibilities. Because the CEO, CFO and COO make executive decisions that influence the direction, stability and profitability of the Company, their overall compensation is intended to strongly align with objective financial measures of the Company. |
| ● | |
| · | Other NEOs: The Company’s Vice President — Chief Accounting Officer and Corporate Controller, Mr. Brad G. O’Connor, and Vice President — Finance and Treasurer, Mr. David G. Valiaveedan, have, as a result of their respective positions, less direct influence on the Company’s strategic and operational decisions. Therefore, overall compensation levels for these NEOs reflect both objective financial measures of the Company and the attainment of personal objectives (as determined by the Committee, which may consult with the CFO, the CEO and other members of senior management)management regarding these determinations). |
Variable Incentive Compensation and Discretionary Awards
The Company’s compensation philosophy emphasizes variable incentive compensation elements (bonus and long-term incentives), the value of which reflects the Company’s financial and stock performance. For executives who report to the CFO, including Messrs. O’Connor and Valiaveedan, the variable compensation elements also include personal performance objectives.
For all executive officers, the Committee retains the flexibility to adjust incentive awards downward or to consider discretionary bonus awards in “special circumstances”special circumstances as described on page 31below under “Discretionary Bonuses.”
Peer Group Considerations
As context for setting the compensation levels for the CEO, CFO and COO in fiscal 2012,2014, the Committee considered the compensation levels and practices of its Peer Group companies. The Company’s Peer Group includes the following 11 publicly-traded homebuilding companies: (1) Beazer Homes USA, Inc.; (2) D.R. Horton, Inc.; (3) KB Home; (4) Lennar Corporation; (5) M.D.C. Holdings, Inc.; (6) Meritage Homes Corporation; (7) NVR, Inc.; (8) Pulte Homes,Group, Inc.; (9) Ryland Group, Inc.; (10) The Standard Pacific Corp.; and (11) Toll Brothers, Inc. The companies in the Peer Group are the same as those used in fiscal 20112013 and were selected by the Committee, in consultation with PM&Pthe Committee’s compensation consultant, F.W. Cook, and management, because of their comparable business profile. In particular, the Company’s revenue size relative to the companies in the Peer Group and the presence of the Peer Group companies in the Company’s markets were considered the most relevant factors for selection of peer companies within the homebuilding industry. The Committee will continue to review the appropriateness of the Peer Group composition. For the other NEOs, the Committee places equal or greater weight on its consideration of internal pay equity, an evaluation of individual performance contributions and other factors described in detail below.
The Committee relies heavily on Peer Group comparisons for the CEO, CFO and COO. Because only fourfive of the 11 Peer Group companies report data for a chief operating officer position, the Committee may also review broad-based compensation survey data for the COO. The Committee periodically reviews the compensation for the other NEOs relative to the Peer Group and broad-based compensation survey data, with consideration of internal pay relationships in years when market benchmarking is not conducted. The Committee does not consider the specific participants in the broad-based compensation survey data to be a material factor in its review.reviews. The Committee believes that a review of market survey data periodically (but not necessarily every year) is sufficient for these positions based on their roles and historical compensation levels. The Committee consideredreviewed broad-based market survey data in connectionfiscal 2014 to assess current market trends with its fiscal 2012respect to compensation determinations.
Consideration of Market Conditions